

Infographic: What puts up your energy bill?
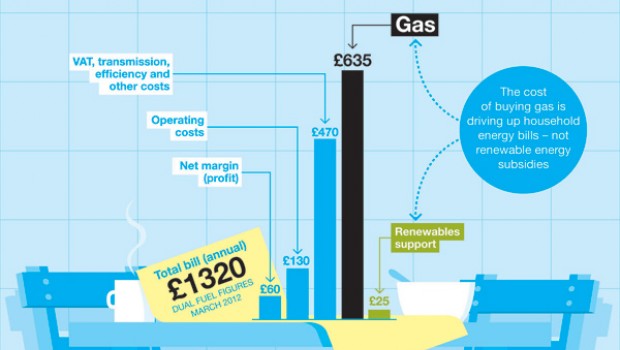
Cost of gas
The figures come from the energy regulator, Ofgem’s “supply market indicator” for March (shortly after the last major changes in bills).
Between March 2011 and March 2012 bills rose by around £150. Around £100 of that was due to the higher wholesale cost of gas – which comes under wholesale cost of power in Ofgem’s numbers.
As Ofgem explain here the wholesale cost is set by power companies buying and selling fuel and power on the market.
The wholesale cost of gas for heating, is quite clearly, set by international gas prices. But the same also applies to electricity. That’s because the cost of gas feeds straight into the cost of power generated by gas, which in turn is the main variable in the price paid by utilities for all electricity.
Because the price of gas is highly changeable the numbers are updated on a weekly basis – the latest one – doesn’t yet include the bill rises from British Gas and SSE, but we’ll update our figures when they come through next week.
It’s worth noting that Ofgem compares your bill in any one month to the same month a year ago. Bills this time last year were also high so this year so far shows bills slightly lower. That is likely to be reversed with this week’s bill rises.
Renewables
So what about the cost of renewables?
The cost of renewables support isn’t in the Ofgem document – instead it’s merged into Vat, Transmission and Other costs (which also include the cost of efficiency schemes), so we got in touch with them directly. An Ofgem spokesperson told us:
“In 2004 ROCs accounted for 1.0% of a dual fuel bill. In March 2012,they account for 1.9% of a dual fuel bill.”
Still following? In short that works out at about £25 a year. The Department of Energy and Climate Change (DECC) has published figures for 2011 which suggest that, that year, renewables added about £17 to the total bills.
The two sets of data may not be completely comparable, but they suggest that the year on year increase due to renewables is around £8.
And wind?
Again this isn’t broken down – either on your household bill or in Ofgem’s statistics. It is, therefore, almost impossible to give an accurate answer.
The key point is that wind only accounts for a portion of the ‘renewables’ element of your bill. Initially far more of this was spent on things like biomass, and we’re still paying for that today.
Renewable technologies are paid for through something called “Renewable Obligation Certificates”, you can work out roughly how much has been spent on any one technology in any one year, therefore, by working out how many have been issued to it.
Renewables UK looked into Ofgem’s latest RO annual report and found the average household spends about £7.74 on wind power – you can check theircalculations here.
Wait… you’ve missed solar
Solar attracted some of the most generous subsidies of any renewable technology – so surely it’s a big factor driving up bills?
No.
Actually it’s so statistically insignificant that the Department of Energy and Climate change don’t even quantify it.
Whilst the subsidy, paid through the Feed-in-Tariff may have been sufficient to promote a high initial take up the treasury severely limited the amount of money from bils which could be used to far less than that available for other technologies.
The result is that the whilst the FiT adds almost nothing to household bills DECC has still been forced to keep cutting the subsidies to solar power.
And margins…
Ofgem’s rolling net margin figure reflects the amount of money, per year, per customer that it thinks is going to the energy supplier. In March it was about £60, then it fell to £45 – that’s pretty low so now Ofgem think the suppliers will push it up to around £65.
On average, it seems to stay pretty constant but there are accusations that suppliers tend to put the price up when the cost of gas rises, and then keep it relatively high, when it falls – in order to profit on their margins.
Update: efficiency
A few people have asked where efficiency measures are paid for in the average bill.
These are the schemes which allow energy companies to offer free insulation in your home and which, under the may be used to fund efforts to reduce fuel poverty or insulate solid walls under the government’s Green Deal.
Like the cost of wind the cost is included by Ofgem under the ‘other’ category.
In their assessment of the impact of meeting carbon budgets on bills the government’s climate advisors, the Committee on Climate Change found that between 2004-10 policies to promote energy efficiency had added £45 to the average bill now accounting for around 5% of the average bill.
However, the CCC argued that without such measures bills for many households may have been higher still as they would have needed more gas to heat their homes.
This story has been updated since publication in response to the comments below.