

In pictures: How China’s air pollution spread
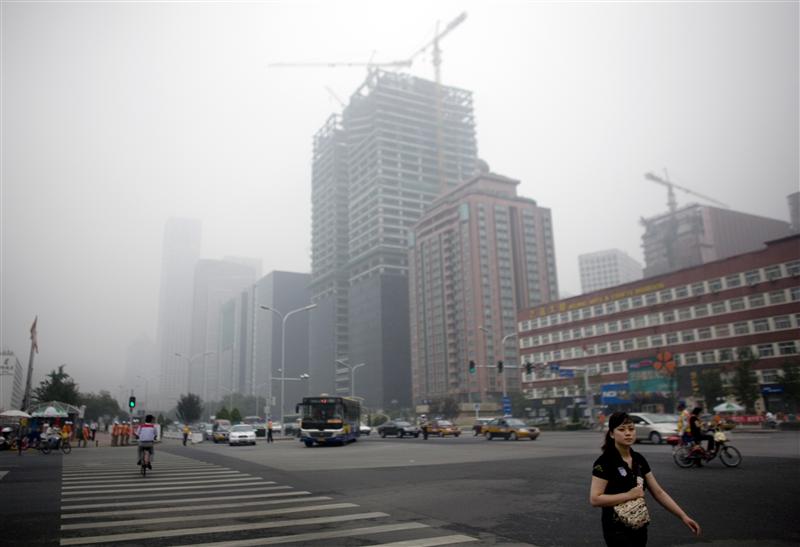
The Chinese capital of Beijing and its surrounding regions are again gripped by dangerous air pollution levels, forcing workers and schoolchildren to stay home.
The situation is now so serious one WHO official reportedly told ABC “we have to see this as a crisis”. It’s also so smoggy images from the ground don’t really work – so we got some from NASA to capture a series of images from space over six days of growing pollution to see what was going on (see below).
Their images show how the pollution travels from the south and east to cover Beijing creating a rancid smog made up partly of micro-particles called PM 2.5 which are a health risk at high concentrations.
The causes are complex but a UK study found coal burning was the single biggest contributor to the problem.
February 19, 5AM GMT. Significant smog to the south of Beijing but the capital itself is clear with winds coming in from the North and Siberia.
Particulate level 107 ug/m3 (Unhealthy for sensitive groups)

February 20, the smog – partially obscured by cloud cover, moves up from the South where much of China’s industry is located as air comes in from provinces to the south of the capital
Particulate level 271 ug/m3 (Very unhealthy)
Beijing is located in a partial basin. Much of China’s coal burning and industry is located to the south and east of Beijing as this Unearthed interactive map shows.

February 21, dense cloud cover over Beijing obscures the smog which can be seen to the south, east and west.
PM 2.5 levels 317 ug/m3 (classed as Hazardous)

February 22, Beijing continues to suffer under smog blown in from the provinces around it and to the south of it
PM 2.5 333 ug/m3 (Hazardous)

February 23, cloud obscures Beijing (smog would be underneath and is not visible) but the air patterns change bringing in additional particulates from industry to the east of Beijing
PM 2.5 levels of 320, ug/m3 (Hazardous)

February 24, the cloud has cleared revealing the startling extent of the smog (the grey) spreading from the east across Beijing and down to the south
PM 2.5 level 347, ug/m3 (Hazardous)

The situation got worse from there, with particulate levels at the top of the US embassy building in Beijing reaching 577 at press time.
See also:
PM 2.5 and all that – a beginners guide to China’s air pollution
Responding to air pollution: How China’s provinces are capping coal
Reporting air pollution – a guide to finding the data on air pollution and wind direction used for this story.
The images give a rough impression of how the pollution has moved but this can be matched with wind data from U.S. NOAA HYSPLIT model. By combining the two you can plot a map showing roughly where the air was coming from on the six days.

And here is where China’s coal plants are: