5 graphs showing what you need to know about renewables investments
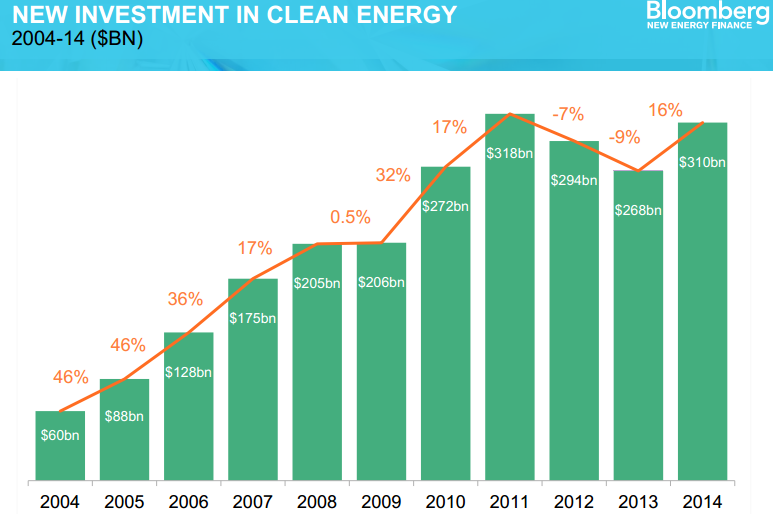
Surges of investment in solar in China and the US, and in offshore wind in Europe, led to a 16% increase in clean energy investment in 2014, according to new data from Bloomberg New Energy Finance.
Investment levels remained below their 2011 peak, however, partially because clean energy has become cheaper (so more is built for less money) but also because fossil fuels continue to dominate the energy mix.
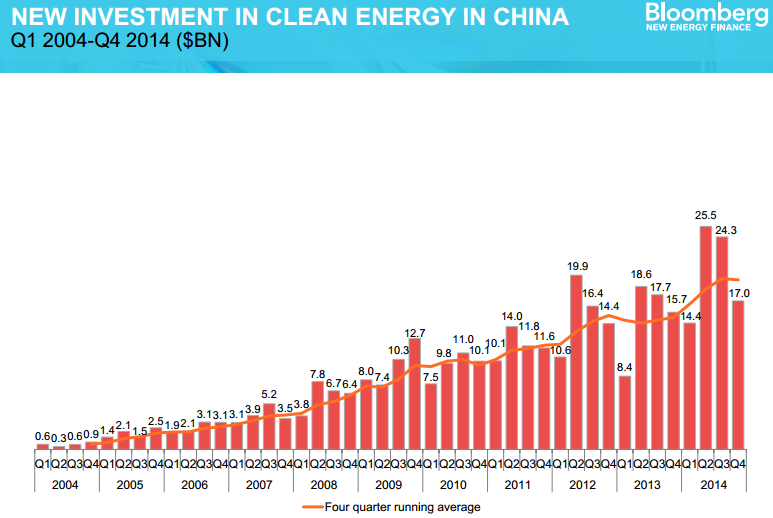
Overall investment rose to $310bn dollars with investment in China up 32% to a record $89.5bn, 29% of the total.
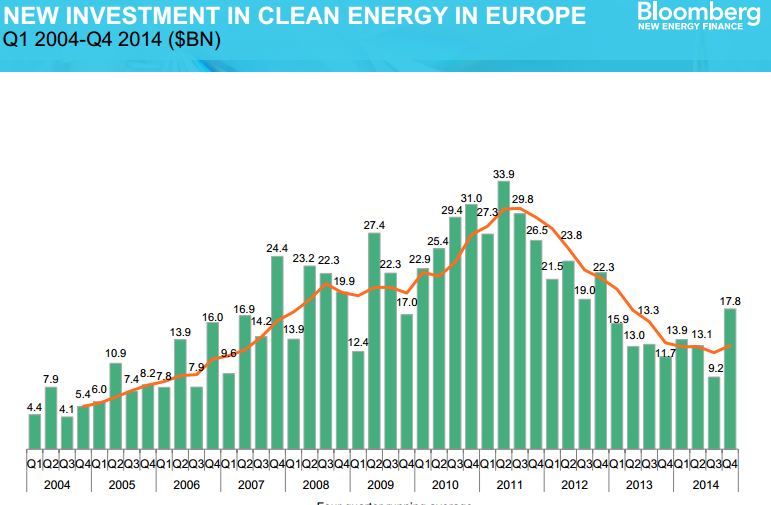
EU investment rose 1% to $66bn, driven by offshore wind deals but now lagging well behind China.
Here are the key details in five charts:
1) Global investment in clean energy has risen again after two years of decline
2) As investment in China climbs it flatlines in Europe
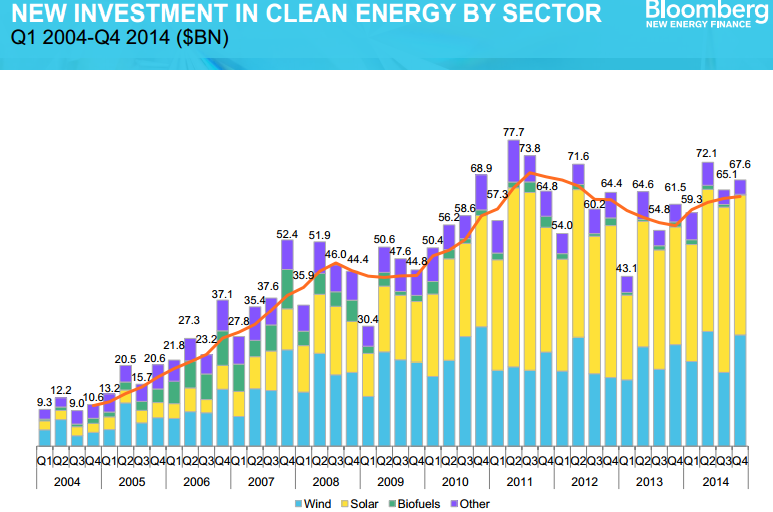
3) Despite sharply falling costs solar investment continues to grow, while wind investment has recovered thanks to (relatively expensive) offshore projects
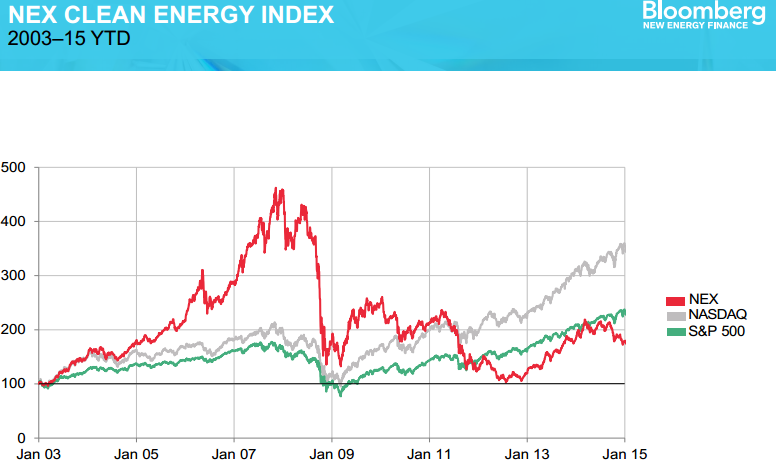
4) Despite the rise in investment, shares in clean energy firms have struggled compared to the main indices