

Beijing’s latest air pollution episode is the longest this century
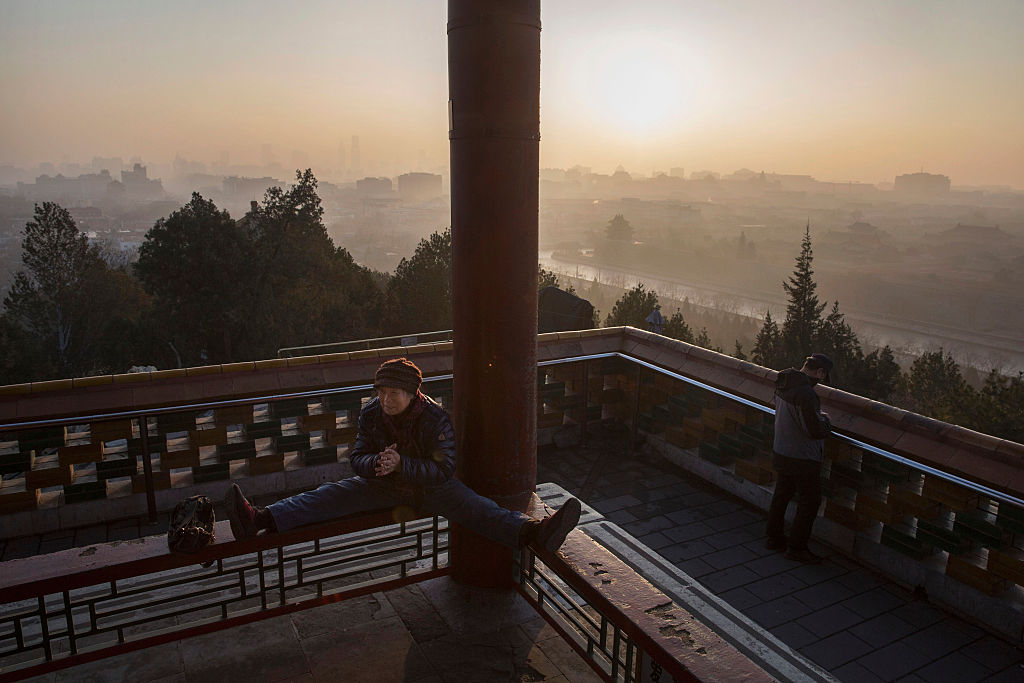
The thick smog that has blanketed Northern China over the first week of the new year is the longest heavy pollution episode seen in Beijing this century, according to an analysis of government data by Greenpeace East Asia.
This record episode follows a resurgence of heavy industry last year, which triggered the return of pollution to the capital after a period of steady improvement in air quality.
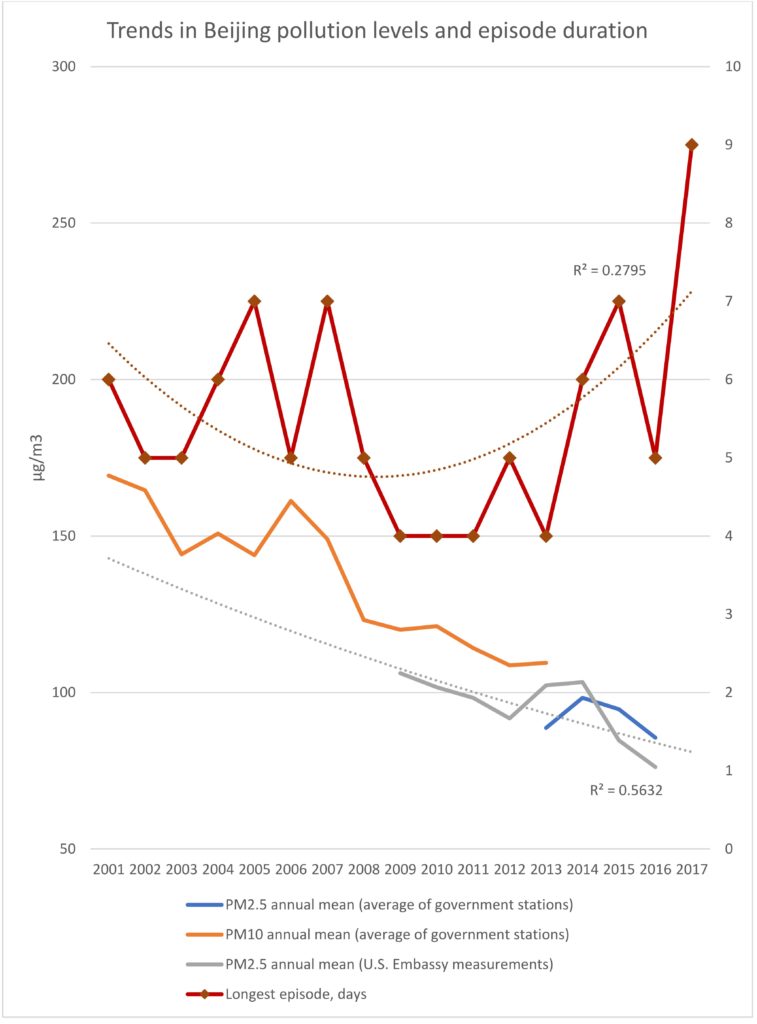
The analysis examined 16 years of official air pollution data in Beijing – beginning in 2001 – and found that for nine days straight between December 30 and January 7, concentrations of the particulate PM2.5 breached 200 on the Air Quality Index (AQI). At this level conditions are considered to be an emergency and too dangerous for outdoor exertion. Seven-day episodes occurred in 2015, 2007 and 2005.
While pollution levels remain dangerously high, Beijing has seen impressive and continuous improvements in average pollution levels over the past 16 years, as the government has implemented strong emissions standards, improved enforcement and set absolute targets for limiting coal consumption to clean up the problem.
But the new analysis suggests that the intense smog episodes that plague the city – most often in winter – are lasting for longer periods of time.
The episode ending on January 7 was even more prolonged than one earlier in December that triggered the first smog “red alert” for a year, and saw factory and power plant output cut back, schools shut down and an alternate-day system used to limit vehicles on the roads.
Neighbouring provincial capitals also experienced some of the longest smog episodes on record. In Tianjin the episode lasted six days, making it the city’s longest since 2001. Jinan, the capital of the industrial powerhouse Shandong, experienced seven days of heavy pollution, which is tied with a 2015 episode for the longest on record.
The smog periods frequently last longer in the rustbelt itself, but only get reported in the media if the pollution gets blown into Beijing by unfavorable wind patterns. The analysis found that in the capital of the steel province Hebei, the recent episode saw a full 11 consecutive days of heavy pollution, while the longest episode on record lasted 27 days.
More frequently occurring unfavorable weather conditions – sustained, slow winds from the south – form part of the explanation. However, these kinds of episodes would not be happening if Hebei and other industrial rustbelt provinces to the south of Beijing had tackled their massive industrial emissions with the same determination as Beijing has tackled its own emissions.
Satellite-based NO2 levels during the December red alert show that the region remained the largest hotspot of pollution emissions in the world – despite improvements in pollution controls and reductions in coal-burning in the previous years, and the emergency measures implemented during the red alert.
How the analysis was done
Since Ministry of Environmental Protection official daily air quality data is currently only available from the beginning of 2014, we relied on two earlier official data sources for the analysis. For 2013, hourly PM2.5 monitoring data was available in real time and was saved from ministry website. For 2001 to 2012, the Ministry of Environmental Protection Air Pollution Index data was used. The data is not online anymore but we downloaded it in early 2013.
In order to combine the data reported under the two different reporting systems, some analysis was needed. The old Air Pollution Index system, used until the beginning of 2013, used PM10 measurements, along with other key pollutants such as NO2 and ozone, to calculate the API, but lacked PM2.5 data. For all high pollution days API was determined by PM10, so the values could be converted directly back to daily average PM10 level.
To establish a relationship between the earlier API system PM10 readings and new PM2.5 readings, we used the U.S. Embassy PM2.5 measurement data which provides a continuous record over the transition from the old system to the new. We calculated the average ratio of MEP PM10 to Embassy PM2.5 during “heavy pollution” days over the 3.5-year period when the two records overlap (2009 to 2012), and the ratio of Embassy PM2.5 to MEP PM2.5 measurements during heavy pollution days over the four-year period from 2013 to 2016. This enabled the conversion of the PM10 values from 2001-2012 into corresponding PM2.5 levels and further into the new AQI.
For data since Jan 11, 2013, we used the daily AQI data published by the MEP. Again, PM2.5 was the main pollutant for essentially all high pollution days so we could convert the AQI reading to the corresponding PM2.5 reading.
Lauri Myllyvirta is a senior coal campaigner for Greenpeace International.