

How green is the transport in Europe’s cities? A story in four charts
Parisians love to walk. Moscow has a serious air pollution problem. And London is not safe for cyclists
Significant changes have been made to this article following updated information from the Wuppertal Institute for Climate, Environment and Energy. A correction is below.
We know that cycling in London can be a nightmare and that air pollution in the city is dreadful, but how does the UK’s capital compare to the rest of Europe? We poured through a new report by the Wuppertal Institute for Climate, Environment and Energy, commissioned by Greenpeace, to find out.
It ranks 13 major European cities to establish how green their transport system is, based on public datasets that look at road safety, public services, bicycle infrastructure and air pollution.
When in Rome, drive. When in Paris, walk. When in Copenhagen, cycle
Rome ranks as the least green city for transport overall in the report, so it’s perhaps no surprise that it has the highest proportion of journeys made by car or other private vehicle, including the moped, which the city is well known for. In fact, only 1% of journeys in Rome are by bicycle.
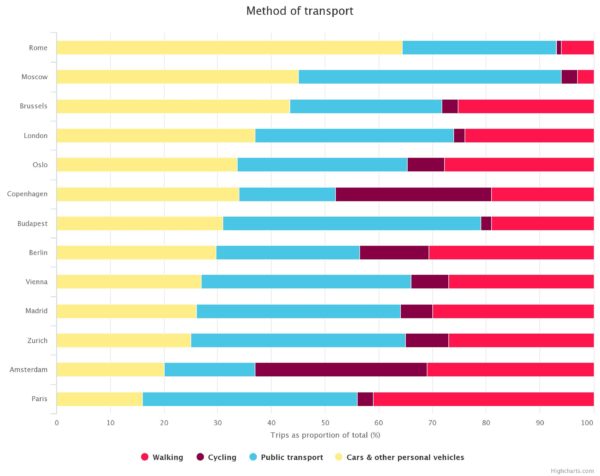
In all of the other cities analysed, private motorised vehicles (that’s things like cars and motorbikes) account for less than half of trips. In Paris, the figure is as low as 16%. That’s because here, most journeys are either on public transport or on foot, making it both the most popular way to get about the city and a larger proportion than any other city. It’s a dense city and Mayor Anne Hidalgo has been pedestrianising streets and introducing a number of car bans.
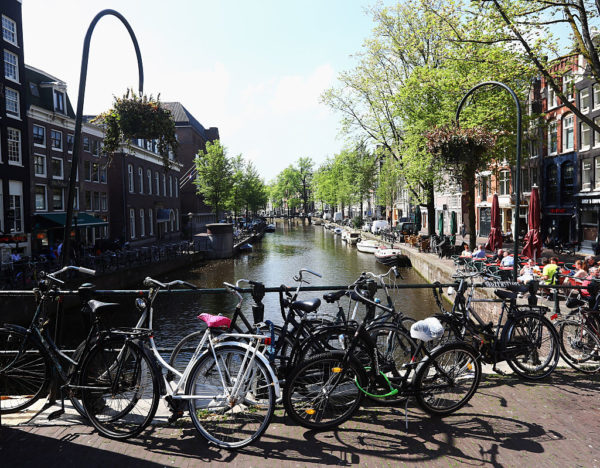
When it comes to bicycles, Amsterdam of course comes out on top. I mean, it is a city where there are famously more bikes than there are people. Almost a third of trips in Amsterdam are by bike, with a similar proportion in Copenhagen, which comes out as the greenest city overall in the report.
London is not safe for cyclists
There are more crashes involving cyclists in London than in any of the other 12 cities. Former Mayor Boris Johnson came under fire for the issue when he was in office and introduced a programme of new segregated cycle lanes before he left. The new man in charge, Sadiq Khan, has pledged to increase the number of cycle routes in the city, though he has been accused of not moving fast enough by campaigners.
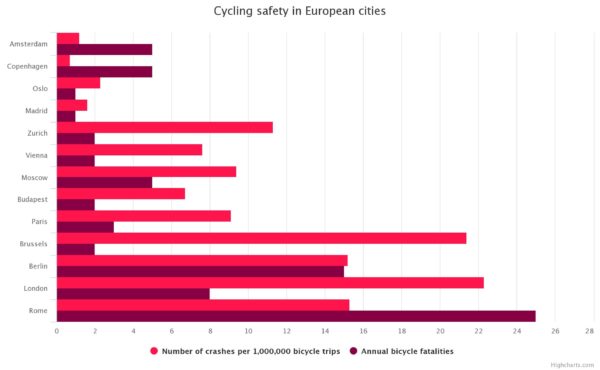
Rome also comes out badly, with the highest number of cycle fatalities.
It’s also clear that once the number of cyclists in a city gets over a certain threshold, it becomes much safer. Copenhagen and Amsterdam have very few crashes. The data suggests you’re 32 times more likely to be involved in a crash in London than you are in Copenhagen.
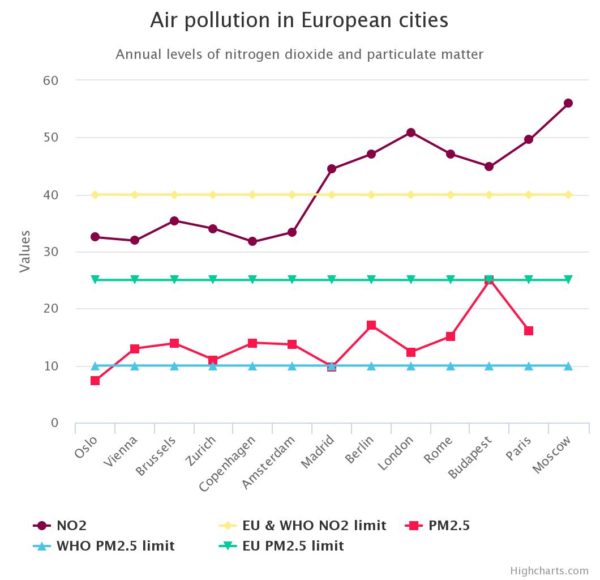
Moscow has a serious air pollution problem
We hear a lot about air pollution in London and Paris, and the data shows that these are two of the worst offenders when it comes to nitrogen dioxide (NO2), the pollutant made famous by the dieselgate scandal.
But Moscow is recording much higher levels. Fumes from traffic are a big part of the problem, with 45% of journeys in the capital taken by private vehicle. The government is now starting to look at the issue.
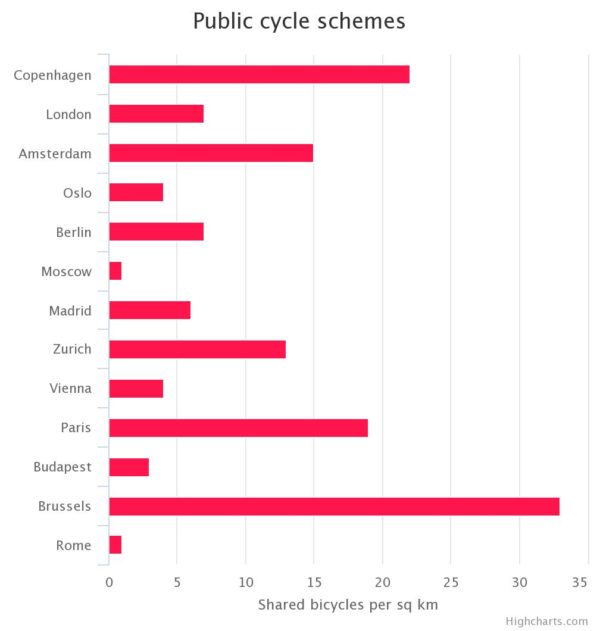
Brussels is big on bike sharing
Brussels has invested in a sharing scheme with 5,000 public bicycles; that’s 33 available for every sq km. That’s a third more than bike haven Copenhagen, which has the next highest density.
But the scheme seems to have failed to inspire its residents. Just 3% of journeys in Belgium’s capital are by bike. This might be because while the city has invested in bikes, it has not invested nearly as much in bike lanes or effective measures to increase road safety.
The same could be said of London and Paris which are much bigger cities and have the biggest schemes of all, with 11,500 and 14,500 bikes respectively. Yet people in these cities take just 2-3% of journeys by bike.
This article was amended on 23.05.2018, following updated data and analysis from the Wuppertal Institute for Climate, Environment and Energy. A number of significant changes were made:
- The figures for the number of crashes across all cities were significantly higher in a previous version of the piece. The chart has been updated to reflect the correct figures across all cities
- The story originally included five charts, including a chart showing public transport costs based on the price of a single ticket. Further analysis suggests it is very hard to reflect a detailed comparison of public transport costs in a chart, due to the complexity of transport charging structures and, especially, London’s variable pricing system. But based on our own best estimates and on prior published research, London remains the most expensive city for public transport but a chart would not provide a meaningful comparison.
- The figures for air pollution in Moscow have been changed based on updated measurements. The figures for NO2 are lower than in the previous version, but Moscow is still significantly higher than all other cities. The article previously said that particulate levels in Moscow were higher than EU limits. The new data suggests figures on particulates are not available, so we have removed this data.