

India air pollution: Delhi readings worse than Beijing average
On his historic visit to India, President Barack Obama has been breathing air six times dirtier than the US standard, a snapshot showing pollution up to twice as toxic as the average for China’s most polluted city Xingtai.
According to analysis from Greenpeace India, New Delhi’s current pollutant particulate levels are among the most severe in the world — 9 times greater than the WHO’s recommended limit and more than twice that of the Beijing smog.
As part of India’s Republic Day celebrations, the US President was due to visit New Delhi landmarks and hotspots that – according to research conducted just three days earlier – have PM2.5 levels way in excess of government and health authority recommendations.
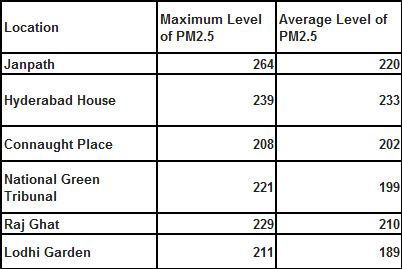
After using a pollution tracking device for five minutes at six Central Delhi locations, Greenpeace India recorded average PM2.5 levels between 189 and 233 micrograms per cubic metre — Indian air standards place the 24hr limit at 60µg/m³.
The worst of the peak pollution recordings was in the busy high street of Janpath where PM2.5 hit an astonishing 264 µg/m³.
PM2.5 is small pollutant particulate matter emitted from exhaust pipes and coal — it can get into lungs and cause respiratory and cardiac problems.
Here’s a table of all the locations:
Unlike China, where the long road to healthy urban air has recently begun, India’s pollution problem is getting worse; this winter PM2.5 peaked at 320 µg/m³.
The pollutant particle India has been grappling with is a byproduct of speedy fossil-fuelled economic growth – cars and coal – and is proven to cause significant damage to the respiratory and cardiac systems of those that regularly inhale it.
PM Modi and President Obama have waxed lyrical over increasingly intimate relations between their nations, but where the US and China last year penned an emissions reduction deal — nothing yet exists on the Indian front.
The data used here is different from that of our recent China air pollution piece; that one looks at data over the course of 2014 for which national and international standards are different.