

Analysis: 4 charts that show what ‘Black Monday’ means for energy markets
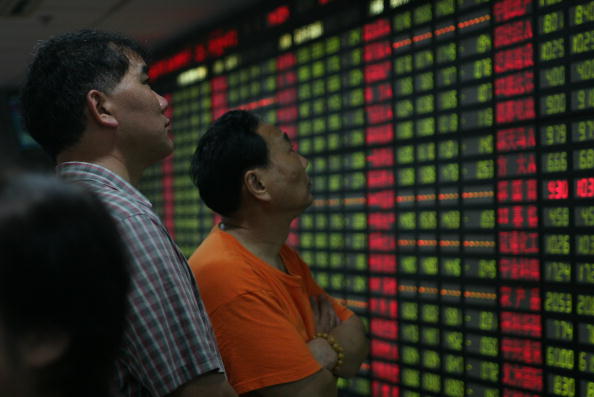
The recent downturn in China’s stock market wiped out an estimated $2 trillion of equity value from the world’s second largest economy, and sent world stocks and commodity prices tumbling in what has become known as ‘Black Monday’.
Equity markets recovered nearly as quickly as they fell in the week after, and now companies and investors around the world must adjust to the yuan devaluation and interest rates cut — the crash’s impact on energy demand is still taking shape.
Here’s what we think so far:
Chinese coal imports are going to get even worse
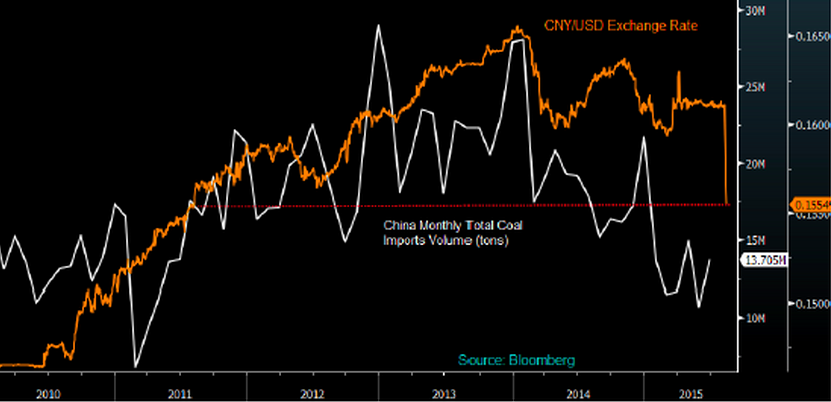
The cost of foreign coal (also oil and gas) will probably increase with the yuan’s devaluation, which may further discourage purchases amid an already glutted market and fast falling Chinese coal imports.
Australian and Indonesian coal exporters are most at risk and highly exposed to Chinese demand fluctuations due to long-term reliance on commodity exports. With such bad news for coal and no end in sight, it’s little wonder the biggest producers are looking to sell down or drop their coal portfolios in Australia.
China’s coal imports, Yuan/Dollar Exchange rate
And they’re going to struggle to export as well
Chinese coal producers may think that the yuan devaluation will provide them new opportunities to export, but that’s not really the case.
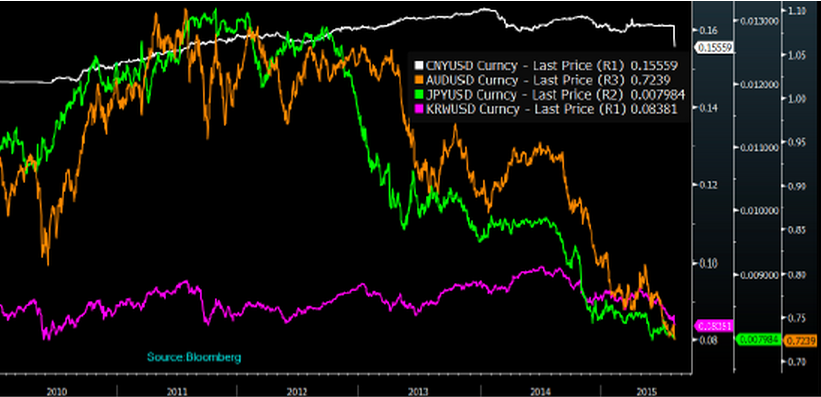
The currencies of most key export markets have also fallen vs the dollar as a result of a “flight to safety” — meaning the devaluation probably won’t be the saving grace Chinese producers were hoping for.
In fact, Japan and Korea have fallen even more against the dollar, while Australia and Indonesia have also depreciated.
Currency depreciation against the dollar
Index:
- White: CNY/USD
- Orange: AUD/USD
- Green: JPY/USD
- Purple: KRW/USD
China’s attempt to encourage investment backfired
To try and provide some market positivity, the Chinese government did something extraordinary and released early electricity consumption statistics for the month of August.
Normally full-month statistics are released halfway through the following month. The release showed that August power consumption grew 3% year-on-year, but overlooked the fact that consumption in August 2014 was remarkably low, having fell 1.4% versus the previous year.
The numbers ultimately reveal that power consumption has only grown by 1.2% so far this year.
Renewables recovering faster than the rest
Throughout the erratic trading and volatile market movements, the relative resilience of renewable energy companies is shining through.
The S&P 500 index and the S&P/TSX Renewable Energy & Clean Technology Index were both hit by the stocks slump, but the latter recovered quickly fully while traditional companies were still down 6% a week after Black Monday.
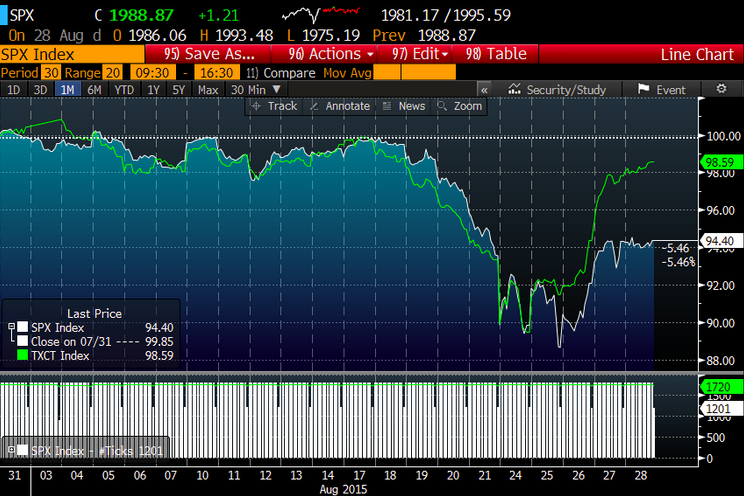
This suggests that renewables are stronger than pure-play coal mining companies in these volatile times.
Vestas Wind Systems, for instance, the world’s biggest wind turbine maker, posted a seventh straight quarterly profit, clearly outperforming the biggest coal mining in the US, Peabody Energy.
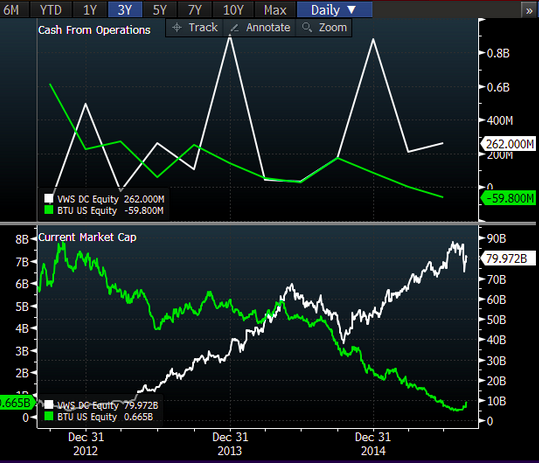
With significant increase in demand from US, Brazil, China and India, global wind power installations are estimated to increase 25% to 60 GW this year, and the longer-term outlook for renewable power equipment sales is strong across the world despite the weak overall economy.
Read more: China crisis: Really really bad day for coal, oil giants